· by Rédaction
How Many Women Are Actually on Video Chat Roulette? What the Data Really Says (and What It Doesn't)
A third? A tenth? The figures on the proportion of women on random video chat circulate without a source. Here's what can actually be measured, why the estimates contradict each other, and what this imbalance concretely means for women users.
"Only 10% of people on chat roulette are women." You've definitely come across the line: in a comment, in an article, from the mouth of a user explaining why you should feel flattered to be there. Sometimes it's 10%, sometimes 20%, sometimes "one woman for every nine men." Never a source. Never a date. Never a method.
That vagueness matters. When a woman wonders whether she'll run into decent conversation partners, the only piece of information she's handed is a made-up number. And when a platform sells a gender filter, it leans on that same assumed scarcity to set its price.
This article does the opposite of taking shortcuts: it looks at what is genuinely measurable in the traffic of a random video chat service, what public measurements do and don't say, and why the four biases undermining them radically change the interpretation. By the end, you'll have an honest sense of the imbalance — and above all of what it means in practice.
Where the Numbers You Read Come From
Three sources, three very different natures
When an article puts forward a proportion of women on a video chat service, it almost always draws on one of these three reservoirs:
- Web audience panels. Measurement companies such as Similarweb or Comscore publish male/female breakdowns by site. Those breakdowns are modelled estimates, built from panels of volunteers and internet service provider data, then extrapolated. Similarweb itself states in its documentation that demographic data are estimates and that their accuracy drops for low-traffic sites or those with atypical audiences.
- Figures released by the platforms. They exist, but they get published when they serve a purpose: a service wanting to reassure women will announce a rising female share; a service selling a paid filter has no interest whatsoever in denying the shortage.
- Academic work. It is scarce, dated, and based on samples of sessions, not on populations. The most cited remains the study by Xianhua Xu, Yao Liu and Bo Han presented in 2011 ("Analyzing user behavior on Chatroulette"), which observed a massive imbalance in favour of men across thousands of sampled connections. Fifteen years later, it is routinely cited as though it described the current state of the market. It does not.
The figure in circulation is a fossil
That's the essential point: most of the percentages circulating in 2026 descend from observations made between 2010 and 2013, on a single platform, at a time when random video chat happened almost exclusively from a desktop computer. In the meantime, mobile has become dominant, automated moderation has gone mainstream, and the audience has fragmented across dozens of services. Copying a 2011 figure to describe 2026 is like describing today's social networks with statistics from the Myspace era.
A percentage with no date and no method isn't a statistic: it's a rumour with a number inside it.
The Four Biases That Make Any Count Fragile
Bias 1: we don't count people, we count sessions
A video chat service almost never requires a user account. What it sees are connections. And a user who fires off 200 "nexts" in an hour generates far more events than a woman holding three twenty-minute conversations.
The consequence: if you measure the share of women among the sessions seen, you underestimate their share among the people present. And if you measure the share of women among accounts or unique visitors, you get a higher figure — without lived reality having shifted one bit. Both numbers are "true"; they simply answer different questions.
This mechanism is the same one described in our article on compulsive "next" syndrome: zapping behaviours are very unevenly distributed across genders, so any metric based on volume of actions is structurally distorted.
Bias 2: gender is guessed, not declared
On a service with no sign-up, nobody fills in a form. So the gender displayed or assumed comes from:
- a voluntary declaration at the moment of choosing a filter or a room;
- an automatic inference from the image (algorithmic classification);
- an inference from behaviour (username, language, time of day).
Each one gets it wrong, and not at random. Image classifiers applied to gender have been documented as markedly less reliable depending on skin tone, lighting and camera angle — that's the central finding of the work by Joy Buolamwini and Timnit Gebru (Gender Shades, MIT Media Lab, 2018), subsequently confirmed by the NIST evaluation campaigns on facial recognition. A poorly lit webcam is enough to flip a classification.
Another perverse effect, well known to women users: some women actively hide their gender — camera pointed at a pet, high framing, mic muted, neutral username. They exist, they're there, and no counter sees them as women. Surveys by Women in Games France on female gamers document exactly the same camouflage reflex in gaming voice chats.
Bias 3: fake profiles artificially inflate the "women" column
This is the most underestimated bias. Looped videos, rebroadcast recordings and bots redirecting to paid links almost all present themselves as female profiles. Any automatic count adds them to the real women users.
In other words: the more a service is infested with fake female profiles, the healthier its measured share of "women" looks. The figure rises while the experience deteriorates. If you want to know how to spot them in a matter of seconds, we laid out the method in spotting looped videos and paid links.
Bias 4: the average flattens the gaps that matter
Even assuming a perfect measurement, a global average describes nobody. The make-up of a service varies considerably according to:
| Variable | Observed effect on audience composition | | --- | --- | | Time of connection | More mixed audience in the early-week evenings, more male and more aggressive after 1 a.m. | | Time zone and language | Regional traffic peaks completely shift the profile of the people you meet | | Device | Mobile broadens the audience, particularly during the day and away from home | | Presence of a paid filter | Concentrates paying men on one side, which changes what unfiltered women see | | Level of moderation | A service that bans quickly retains more women users over time |
We had already measured the effect of the first row of this table in the hour makes the audience: the same service, two hours apart, simply doesn't offer you the same people.

What Can Honestly Be Said
Three solid statements
By cross-referencing what is documented with what is methodologically defensible, three things can be put forward without lying:
- The imbalance exists and it is substantial. Every available source — panels, older academic work, first-hand accounts, and the mere existence of a market for paid gender filters — points in the same direction. Nobody charges a premium for access to an abundant population.
- Its exact scale is publicly unknown. No independent, recent, multi-platform and methodologically transparent measurement is available. Anyone giving you a percentage down to the decimal point is improvising.
- The imbalance as experienced is sharper than the demographic imbalance. Because male users consume more sessions per person, a woman encounters proportionally even more men than the distribution of people would suggest.
That third line is the most useful, and it's the one no copy-paste article ever puts into words.
The best available indicator: your own notebook
In the absence of reliable statistics, the most honest measurement is local. Noting, across ten sessions, how many led to a decent exchange, how many turned into an inappropriate request, how many were video loops, will give you in a single evening a far more actionable picture than any global percentage. A plain spiral notebook sitting next to the keyboard is enough; the whole point is not to do it in a file you'll forget about.
Three columns are plenty: time, outcome of the exchange, reason for leaving. After a week, the patterns emerge — and they're often very different from what you assumed. Many women users discover this way that their rate of decent exchanges depends first on the hour, then on the quality of their image, and only marginally on the service used.
Why This Figure Is Politically Loaded
Scarcity as a sales pitch
The imbalance isn't just a data point: it's a business model. A service charging for priority access to female profiles monetises the shortage directly. It therefore has a structural interest in that shortage being perceived as severe — and no interest at all in publishing transparent measurements. We dissected this mechanism and what you're actually buying in paid gender filters.
Scarcity as an excuse
The other use of the figure is rhetorical. "There are so few women here, it's normal that everyone jumps on you": the sentence turns a fuzzy statistic into a justification for behaviours that are, for their part, perfectly defined in law. Unsolicited exposure in front of a camera remains a criminal offence, whatever the make-up of the audience — that's the subject of our deep dive on what the law says and how to report.
The "minority, therefore coveted, therefore tolerant" line of reasoning is precisely the one that research on cyberviolence against women, catalogued notably by EIGE (the European Institute for Gender Equality), identifies as a normalisation mechanism. A proportion has never amounted to permission.
What the Imbalance Concretely Changes for You
You're filtered before you speak
When a handful of female profiles is spread across a very large number of men, the attention landing on you isn't proportional to what you do: it's saturated in advance. Two practical consequences.
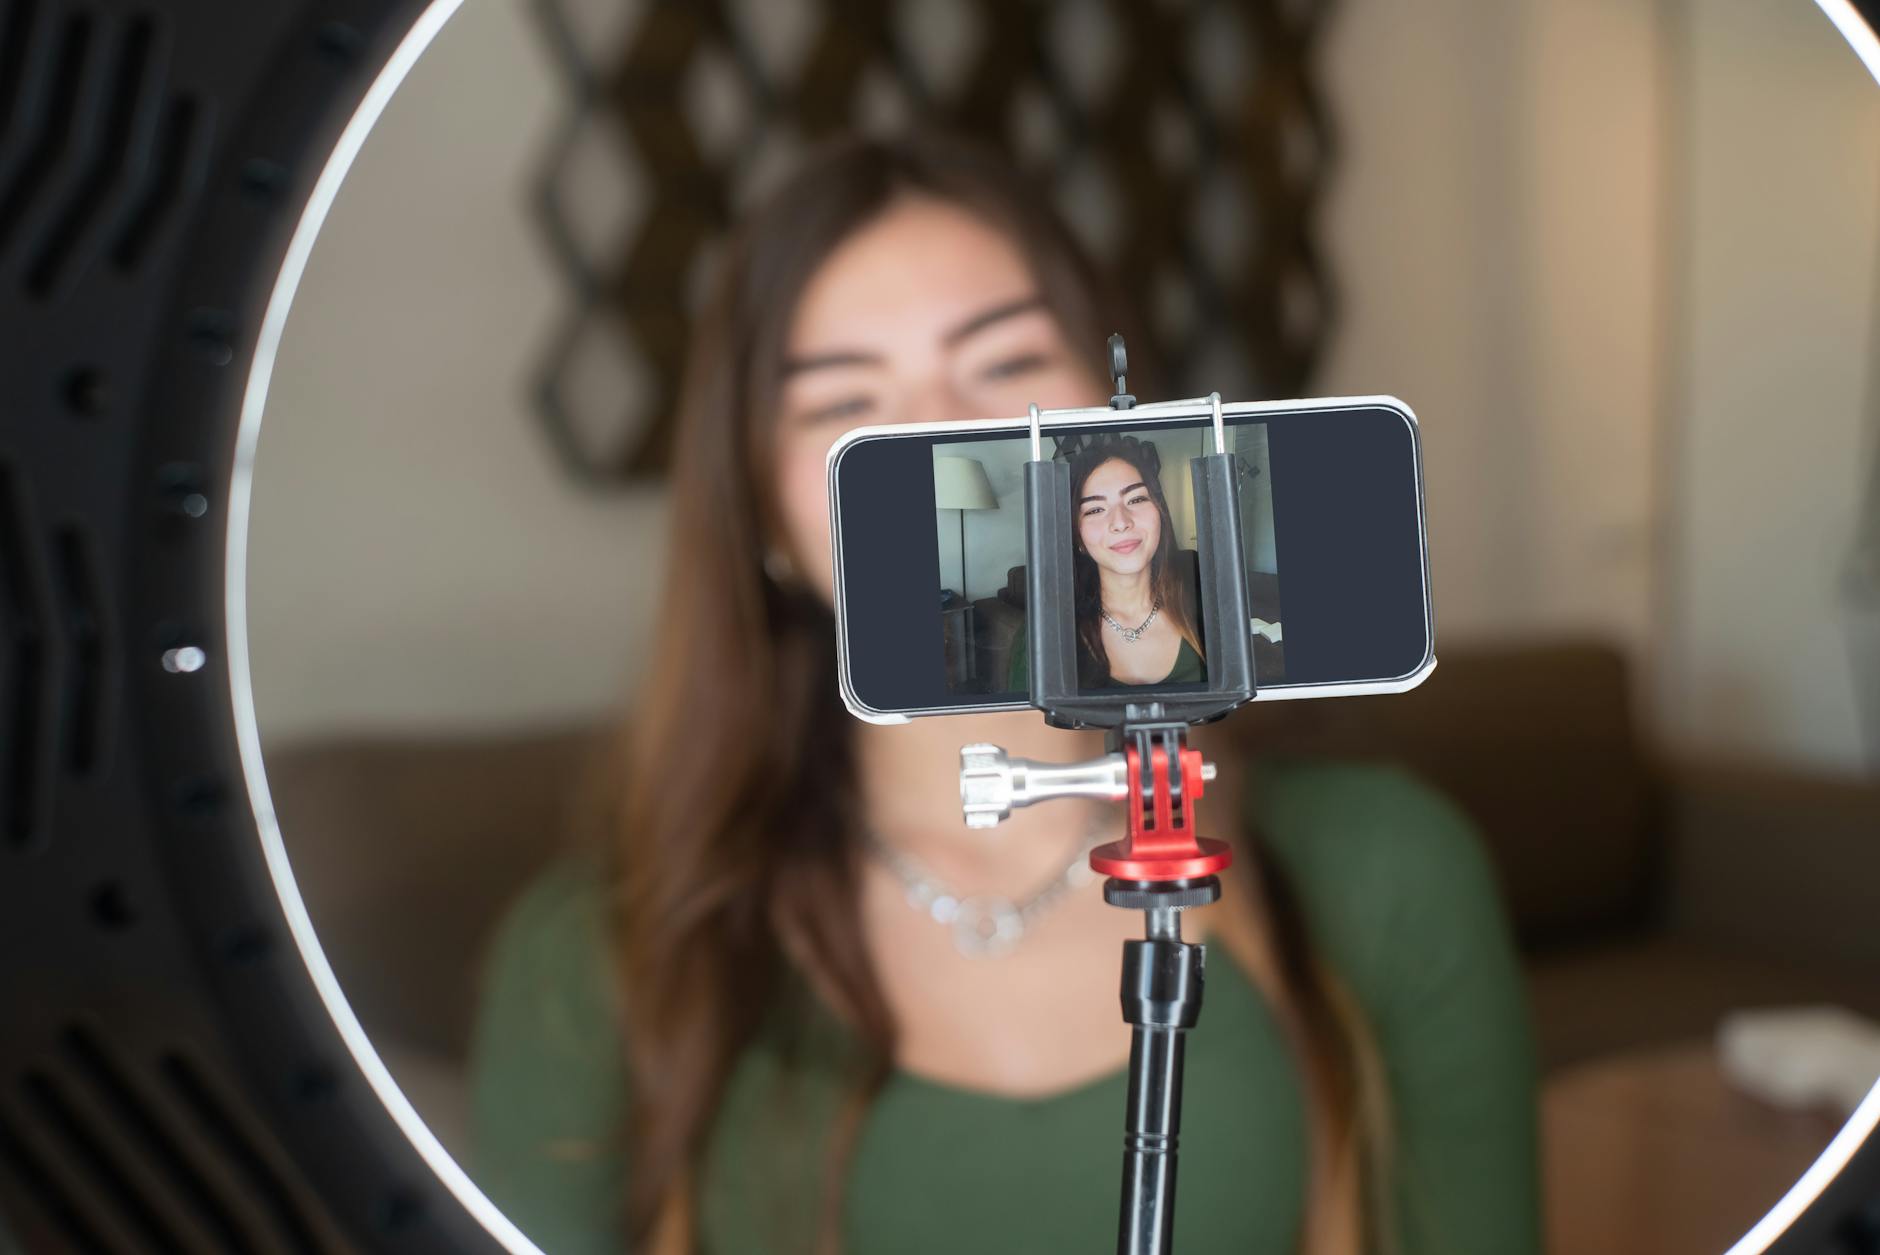
First, your visual signal carries enormous weight, because it's the only sorting element available in the first two seconds. A sharp, well-exposed image doesn't make you more desirable: it makes you legible, which reduces the share of people who drop out through sheer confusion. A small dimmable LED lamp placed behind the screen single-handedly fixes most indoor backlighting problems. We cover the rest in getting your background and lighting right.
Second, your audio matters more than you think. In an environment where the other person is looking for a pretext to zap, muddy sound is an excellent one. A wired noise-cancelling headset solves the problem on a modest budget, and avoids the audio feedback that sends people running.
You have unusual sorting power — use it
The mechanical flip side of the imbalance: you have no obligation to make a conversation pay off. Where a male user has to keep clicking through to hope for an exchange, you can afford to be demanding from the very first sentence. Zapping isn't rude in an environment designed for it; it's the selection tool the format hands you.
In practice, that means:
- Setting a single criterion and sticking to it: for example, anyone who hasn't said a word within five seconds gets skipped. Deciding in advance saves you decision fatigue.
- Rationing session length. Past a certain point, weariness makes you accept exchanges you'd have ruled out earlier in the evening. That's the mechanism described in zapping fatigue.
- Changing the hour rather than the platform when a session goes badly. The lever is far more effective.
What to expect from a first exchange
Since the supply of attention is abundant, the reasonable bar is high: someone who introduces themselves, who asks a question about something other than your appearance, and who takes a "no" without pushing back. That's little enough, and yet it's the filter that eliminates the majority of sessions. If you'd like the mirror version of this standard — what makes women hit next — our two articles on the recurring harassment of women on live streams and the first five seconds complement each other nicely.
How to Read a Figure Next Time
Before giving any credence to a percentage about the make-up of a video chat, four questions are enough:
| Question | If the answer is missing… | | --- | --- | | What's the collection date? | The figure may describe an internet that no longer exists | | Who measured it, and with what interest? | A service selling a filter is not a neutral source | | Are we counting people or sessions? | The two give very different results | | Is gender declared or inferred? | Automatic inference gets it wrong, and not at random |
All four are missing from virtually all the content circulating on the subject. That in itself is information: if nobody can answer, it's because nobody has measured.
As for what is verifiable and dated on the video chat usage side, our industry statistics page gathers what can be sourced, and the try video chat page lets you test the theory against a real evening. If you'd rather keep reading before connecting, the blog articles cover most of the situations you'll come across.
One last word on method: reading two or three pages of a popular introduction to statistics — something like a practical guide to statistical literacy — permanently changes your relationship with this kind of number. Above all, it teaches you to tell apart what has been measured from what has been narrated. In a field where almost everything is narrated, that's the most useful tool there is.
Key Takeaways
- The "10% women" figure has no dated source: it descends from observations made in the early 2010s on a single platform.
- Four biases make any count fragile: session ≠ person, gender inferred rather than declared, fake female profiles counted as women, and averages that flatten differences in time of day, language and device.
- The imbalance is real and substantial, but its exact scale is publicly unknown — and the imbalance as experienced exceeds the demographic one, because men consume more sessions per person.
- Scarcity serves as a sales pitch (paid filters) and as a rhetorical excuse. It authorises nothing: a proportion is not a right.
- The only useful measurement is local: ten sessions logged, three columns, one week. It will tell you more than any percentage repeated without a source.